This package is a suite of helper functions that can be used at Gavi. It has functions to help simplify repeat procedures, like loading common data, gavi specific colors and themes for plots and tables, and functions which add and filter common varibles like country groupings and iso3 codes.
Installation
You can install the development version of gavir from GitHub with:
# install.packages("devtools")
devtools::install_github("joshualorin/gavir")
Examples
You can use the get_*() functions to load data:
library(gavir)
library(tidyverse, warn.conflicts = F, verbose = F)
#> ── Attaching packages ─────────────────────────────────────── tidyverse 1.3.2 ──
#> ✔ ggplot2 3.4.3     ✔ purrr   1.0.2
#> ✔ tibble  3.2.1     ✔ dplyr   1.1.2
#> ✔ tidyr   1.3.0     ✔ stringr 1.5.0
#> ✔ readr   2.1.4     ✔ forcats 0.5.2
#> ── Conflicts ────────────────────────────────────────── tidyverse_conflicts() ──
#> ✖ dplyr::filter() masks stats::filter()
#> ✖ dplyr::lag()    masks stats::lag()

# all functions require a version date
get_groupings("2023-07")
#> Reading in groupings file dated: 2023-07
#> Interesting! The groupings file you have selected is not the most recent. If this was unintentional, you can update to the most recent file, which is 2023-08
#> # A tibble: 196 × 61
#>    iso3  iso3_num iso2  country  country_short lang  global gavi77 gavi73 gavi72
#>    <chr>    <dbl> <chr> <chr>    <chr>         <chr>  <dbl>  <dbl>  <dbl>  <dbl>
#>  1 AFG          4 AF    Afghani… Afghanistan   eng        1      1      1      1
#>  2 AGO         24 AO    Angola   Angola        eng        1      1      1      1
#>  3 ALB          8 AL    Albania  Albania       eng        1      1      0      0
#>  4 AND         20 AD    Andorra  Andorra       eng        1      0      0      0
#>  5 ARE        784 AE    United … United Arab … eng        1      0      0      0
#>  6 ARG         32 AR    Argenti… Argentina     eng        1      0      0      0
#>  7 ARM         51 AM    Armenia  Armenia       eng        1      1      1      1
#>  8 ATG         28 AG    Antigua… Antigua and … eng        1      0      0      0
#>  9 AUS         36 AU    Austral… Australia     eng        1      0      0      0
#> 10 AUT         40 AT    Austria  Austria       eng        1      0      0      0
#> # ℹ 186 more rows
#> # ℹ 51 more variables: gavi68 <dbl>, gavi57 <dbl>, gavi55 <dbl>, mics45 <dbl>,
#> #   dov96 <dbl>, vimc112 <dbl>, who_region <chr>, gavi_region <chr>,
#> #   gavi_region_short <chr>, pef_type <chr>, continental_africa <dbl>,
#> #   francophone <chr>, indo_pacific <dbl>, regional_je <dbl>,
#> #   regional_mena <dbl>, regional_yfv_2016 <dbl>, regional_yfv_2020 <dbl>,
#> #   regional_ipv <dbl>, segments_2020 <chr>, segments_2021 <chr>, …

# and most have additional parameters you can fiddle with
get_ihme("2023-02", source = "subnational", vaccine = "dtp3")
#> Reading in Subnational IHME file dated 2023-02 and aggregated to polio shapes
#> Rows: 1217964 Columns: 17── Column specification ────────────────────────────────────────────────────────
#> Delimiter: ","
#> chr (8): iso3, admin2, admin2_code, vaccine, admin1, admin1_code, pop_model,...
#> dbl (9): year, coverage, pu1_final, unvax_total, pct_unvax, upper, lower, pu...
#> ℹ Use `spec()` to retrieve the full column specification for this data.
#> ℹ Specify the column types or set `show_col_types = FALSE` to quiet this message.
#> # A tibble: 405,988 × 17
#>    iso3  admin2         admin2_code  year vaccine coverage pu1_final unvax_total
#>    <chr> <chr>          <chr>       <dbl> <chr>      <dbl>     <dbl>       <dbl>
#>  1 ETH   MAO KOMO SPEC… {00061F00-…  2000 dtp3       0.174     1723.       1424.
#>  2 ETH   MAO KOMO SPEC… {00061F00-…  2001 dtp3       0.269     1760.       1287.
#>  3 ETH   MAO KOMO SPEC… {00061F00-…  2002 dtp3       0.255     1792.       1335.
#>  4 ETH   MAO KOMO SPEC… {00061F00-…  2003 dtp3       0.215     1807.       1419.
#>  5 ETH   MAO KOMO SPEC… {00061F00-…  2004 dtp3       0.259     1846.       1368.
#>  6 ETH   MAO KOMO SPEC… {00061F00-…  2005 dtp3       0.299     1885.       1320.
#>  7 ETH   MAO KOMO SPEC… {00061F00-…  2006 dtp3       0.339     1906.       1261.
#>  8 ETH   MAO KOMO SPEC… {00061F00-…  2007 dtp3       0.385     1931.       1188.
#>  9 ETH   MAO KOMO SPEC… {00061F00-…  2008 dtp3       0.455     1955.       1065.
#> 10 ETH   MAO KOMO SPEC… {00061F00-…  2009 dtp3       0.485     1958.       1007.
#> # ℹ 405,978 more rows
#> # ℹ 9 more variables: pct_unvax <dbl>, admin1 <chr>, admin1_code <chr>,
#> #   pop_model <chr>, pop_adjustment <chr>, upper <dbl>, lower <dbl>,
#> #   pu1_uncalib <dbl>, pu1_calib <dbl>
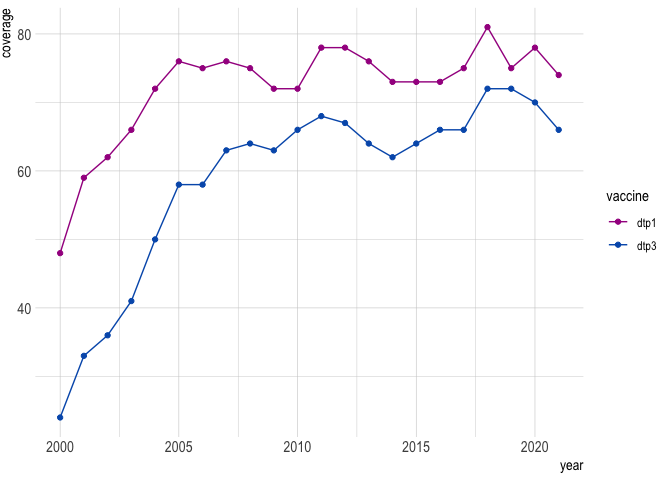
theme_*() and scale_*() functions allow for standard gavi formatting and colors:
wuenic %>%
 filter(iso3 == "AFG" & vaccine %in% c("dtp1", "dtp3")) %>%
 ggplot(aes(year, coverage, color = vaccine)) +
 geom_line() +
 geom_point() +
 scale_color_gavi() +
 theme_gavi()
